
The Power BI Interactive Dashboard: 365HomeBuilder Financial Statements gives an executive-ready view of core financials—letting leaders flip between Income Statement and Balance Sheet views, compare current vs. prior periods and budgets, and drill into GL accounts to see what’s driving revenue, COGS, expenses, and net income. With interactive filters (e.g., by period or entity) and drill-through typical of Power BI, it streamlines month-end review, standardizes reporting, and helps finance quickly validate variances and complete month-end close with confidence.


Unlock the Future of Smarter Selling
Book a consultation with a Dynamics 365 Sales expert to discover how AI and human connection can work hand-in-hand.

Featured Posts
1 min
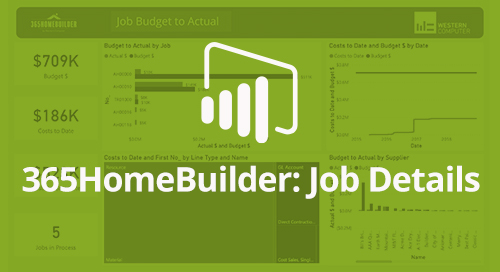
Power BI Interactive Dashboard: 365HomeBuilder Job Details
The Power BI Interactive Dashboard: 365HomeBuilder Job Details gives a drill-down view of an individual job—bringing....
1 min

Power BI Interactive Dashboard: 365HomeBuilder Accounts Payable
The Power BI Interactive Dashboard: 365HomeBuilder Accounts Payable gives finance teams a real-time view of AP....
1 min
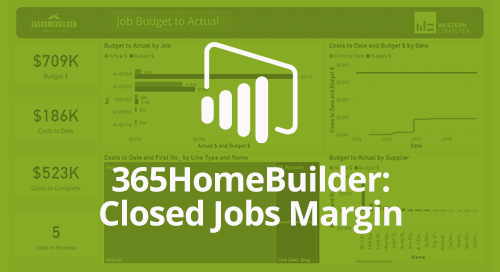
Power BI Interactive Dashboard: 365HomeBuilder Closed Jobs Margin
The Power BI Interactive Dashboard: 365HomeBuilder Closed Jobs Margin gives homebuilders a focused, post-completion....