
This Sales Summary report puts all of your company's important sales data into a single, easy-to-use dashboard. It highlights key sales performance metrics such as total revenue, margin performance, average order size, and sales growth patterns over time, across product lines, and by customer segment. The report gives leadership and sales teams useful information that they can use to make decisions. They can filter by region or channel, look at top customers or items, and compare actuals to targets. It helps people make better decisions, change their strategies based on what they learn, and get sales and business goals to work better together by translating raw sales data into an easy-to-read summary view.
![Power BI Interactive Report: Sales Summary [D365 Business Central]](https://www.westerncomputer.com/hs-fs/hubfs/Imported_Blog_Media/aHViPTc1MTAyJmNtZD1pdGVtZWRpdG9yaW1hZ2UmZmlsZW5hbWU9aXRlbWVkaXRvcmltYWdlXzY1MGIzNjVjZDM4NmIucG5nJnZlcnNpb249MDAwMCZzaWc9Mjc3YjExMjE5MGIyMThiNmM4NTJlY-1.png?width=1296&height=678&name=aHViPTc1MTAyJmNtZD1pdGVtZWRpdG9yaW1hZ2UmZmlsZW5hbWU9aXRlbWVkaXRvcmltYWdlXzY1MGIzNjVjZDM4NmIucG5nJnZlcnNpb249MDAwMCZzaWc9Mjc3YjExMjE5MGIyMThiNmM4NTJlY-1.png)

Unlock the Future of Smarter Selling
Book a consultation with a Dynamics 365 Sales expert to discover how AI and human connection can work hand-in-hand.

Featured Posts
1 min
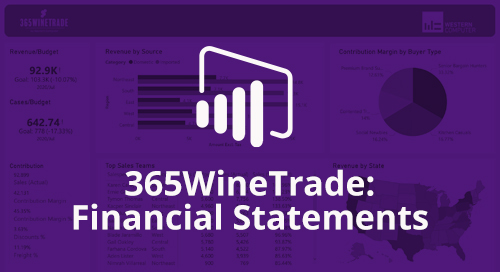
Power BI Interactive Dashboard: 365WineTrade Financial Statements
The Power BI Interactive Dashboard: 365WineTrade Financial Statements gives wine & spirits finance leaders an....
1 min
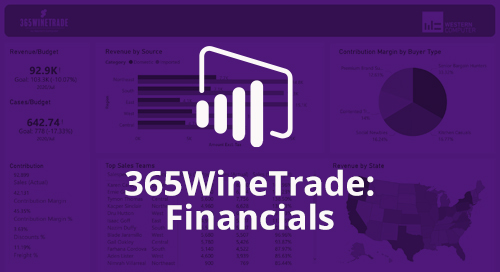
Power BI Interactive Dashboard: 365WineTrade Financials
The 365WineTrade Financial Statements dashboard provides a clear view of core financials. Users can switch between....
1 min
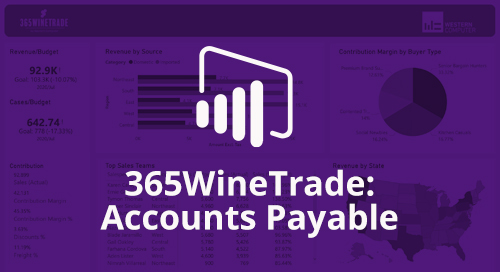
Power BI Interactive Dashboard: 365WineTrade Accounts Payable
The Accounts Payable dashboard for Dynamics 365 Business Central provides an interactive view of vendor liabilities,....